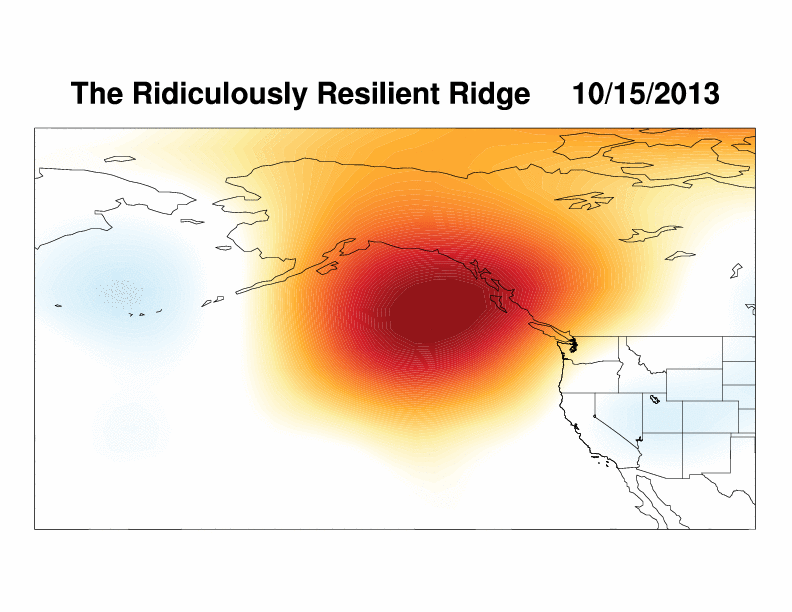
Why has the North Pacific/West Coast ridge been so “ridiculously resilient”?
Most persistent atmospheric anomalies are ultimately linked to unusual patterns of ocean surface temperature. Indeed, most of the well-known modes of variability in the Pacific region (such as the El Niño/Southern Oscillation [ENSO] or the Pacific Decadal Oscillation [PDO]) are direct result of changes in sea surface temperature (SST) patterns over time scales ranging from years to decades. SST anomalies can drive persistent atmospheric anomalies because the ocean has a great deal more “thermal memory” than the atmosphere. Since ocean temperatures are therefore much less variable on “weather” time scales (i.e. days to months) than the atmosphere itself, SST anomalies can exert a substantial, steady influence upon the rather “noisy” (highly variable) overlying atmosphere–shifting storm tracks, enhancing or reducing the amplitude of atmospheric wave patterns, and sometimes causing significant meteorological extremes (including heat waves, cold snaps, floods, and droughts). While the immediate impact of unusually warm or cool SSTs is usually felt by the atmosphere in the the immediate vicinity, geographically-remote atmospheric effects (known as “teleconnections“) can occur thousands of miles away.
Several recent studies have examined precisely this possibility in assessing cause of the extraordinary persistence of the Ridiculously Resilient Ridge in 2013 and 2014. Wang et al. (2014) find that tropical West Pacific SST warm anomalies (associated with the West Pacific Warm Pool that acts as a precursor of El Niño) played a leading role in causing the strength and longevity of the Triple R by generating a recurring series of atmospheric “Rossby waves” that propagated from west to east across the Pacific Basin. Wang and Schubert (2014) find that the North Pacific SST warm anomalies during early 2013 created a “predilection” for dry conditions during the second half of the 2013-2013 “rainy season” in California, and Funk et al. (2014) also report that the observed Pacific SST anomalies during 2013-2014 contributed to the extremely low precipitation that was observed during 2013-2014.
However, Funk et al. also note that it’s possible the record-breaking warmth in the North Pacific (discussed further below) was actually a geographically remote response to the changes elsewhere in the Pacific–similar to the mechanism considered by Wang et al. It’s even possible that that the Triple R played a role in sustaining itself by reducing North Pacific storm activity and preventing vertical mixing of cooler sub-surface ocean water, culminating in a self-reinforcing feedback loop by which atmospheric ridging led to warm SSTs , which in turn led to more ridging, and so on. Regardless of whether the record-breaking warmth in the North Pacific was the primary cause of the Triple R or merely a secondary one, it’s pretty clear that Pacific SST anomalies contributed to the persistent northeastern Pacific ridging and extremely low California precipitation observed in 2013-2014.
It’s also worth noting here that some portion of the Triple R’s extreme magnitude and persistence probably stems from “internal atmospheric variability”–in other words: bad luck. The weather on planet Earth exhibits a considerable degree of random variation, and sometimes the sequence of ridges and troughs in the upper atmosphere just so happens to line up in a very similar configuration for weeks (or even months) on end. A good example of this is the astonishing magnitude of the Triple R during January 2014, which caused jet stream to take an enormous, looping detour from the subtropical Pacific northeast of the Hawaiian Islands all the way to the high Arctic, over the frozen Chukchi Sea north of Alaska.
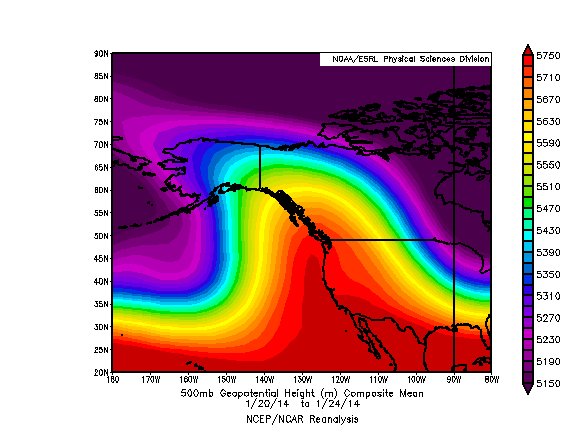
While the Triple R was already firmly entrenched by that point, the West Pacific/North Pacific SST anomalies did not change drastically between December 2013 and January 2014. Therefore, it’s probable that the massive Western North American ridge in January 2014 was enhanced by the random coincidence of processes in the atmosphere. Over longer periods of time, however, it becomes increasingly unlikely that the Triple R could have persisted as a cohesive feature over two consecutive winter seasons by random chance alone, which supports the notion that highly unusual ocean temperatures played a fundamental role.
Has climate change increased the likelihood of events like the 2013-2014 California drought?
The 2013-2014 California drought is clearly an extreme meteorological event in the context of observed climate of the 20th and early 21st centuries. Given the extremity of the physical event and the severity of the impacts in California, an important question arises: has human-caused climate change influenced the likelihood of an event like the ongoing California drought?
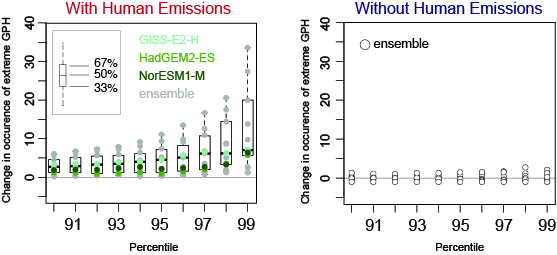
One of the primary tools used to investigate our atmosphere on a planetary scale are global climate models. These models—which are comprised of mathematical equations based upon fundamental principles of physics and chemistry—can be used to conduct “controlled experiments” involving the Earth’s climate system. In our study on the California drought, we used data from an ensemble of different climate models developed by various international research institutions to assess differences between two hypothetical climates: one in which humans never emitted greenhouse gases into the atmosphere (and only natural variations, like those resulting from volcanic eruptions and changes in solar activity, took place), and another that closely parallels the real world, in which natural variations occurred in addition to the human emission of greenhouse gases.
Using these climate model simulations, we found that the human emission of greenhouse gases has very likely tripled the likelihood of experiencing large-scale atmospheric conditions similar to those observed in 2013.* This claim is based upon the simulated 500mb geopotential heights over the northeastern Pacific Ocean, which are strongly related to California precipitation. We further find that years with extreme geopotential heights in the climate models exhibit a Triple R-like regional maximum in the northeastern Pacific, and are associated with shifts in wind patterns and precipitation along the West Coast that are strongly reminiscent of those which occurred during 2013-2014.*
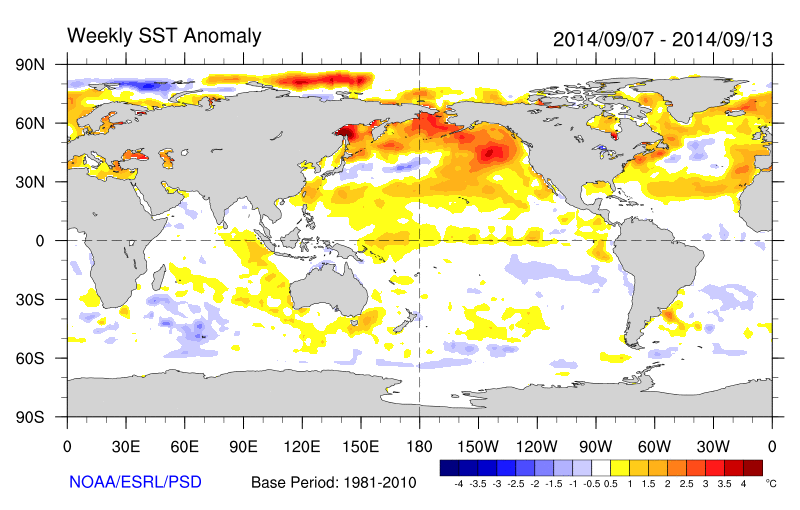
Our approach in Swain et al. (2014) doesn’t allow us to determine whether the amplitude of the flow pattern itself (i.e. its “ridgey-ness”) is increasing, nor whether years with extremely low precipitation have become more common. However, Wang et al. (2014) find that the so-called “North American dipole” pattern—which includes the West Coast Triple R—has strengthened and become more variable over the 20th century due to human-caused climate change. More specifically, they find that the relationship between the previously mentioned “El Niño precursor” teleconnection (linking the West Pacific SST anomalies to northeastern Pacific geopotential heights, and subsequently to California precipitation) has strengthened in recent decades due to the emission of greenhouse gases. Further evidence suggests that the extremely warm North Pacific ocean temperatures observed during 2013-2014, which are linked to the extremely persistent region of high pressure associated with the Triple R, would have been highly unlikely to occur if not for the human emission of greenhouse gases (Funk et al. 2014). This region of exceptionally high, record-breaking SSTs–which persists as of late September 2014–has started to garner considerable interest in oceanographic circles (where it has come to be known colloquially as “The Blob“).
Accurately modeling precipitation in a geographically and topographically complex region like California can be tricky, and none of the studies I’ve mentioned in this article explicitly link the extremely low 2013-2014 precipitation in California to climate change. However, since climate models are better able to capture broad patterns of middle atmospheric pressure (which are strongly linked to precipitation) than precipitation itself, it’s likely that we can still say something meaningful about trends in large-scale atmospheric patterns conducive to low precipitation (and, therefore, drought). Coincident with the increasing amplitude and variability of the “dipole” pattern (Wang et al. 2014), big swings in California precipitation (i.e. the occurrence of both very wet years and very dry years) are expected to become more common over the course of the 21st century (Wang et al. 2014, Funk et al. 2014). The increasingly extreme behavior of precipitation in California–which could very well occur without much of a change in California’s overall average precipitation–may increase the risk of both drought and flood events in the state.
On a related note, there has been a considerable amount of recent interest focused upon a possible increase in the frequency and/or intensity of high-amplitude atmospheric wave patterns (and associated extreme weather events) due to enhanced warming of the Arctic over the past 2-3 decades. While this possibility presents intriguing (and challenging) scientific questions, neither our paper nor any other published research of which I’m currently aware directly link the current California drought with this hypothesized “Arctic amplification” mechanism (though an older study by Sewall and Sloan (2004) suggests that persistent North Pacific ridging could be linked to reductions in Arctic sea ice).
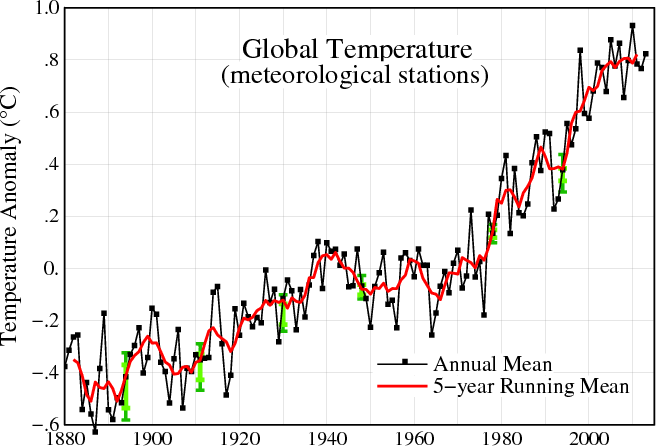
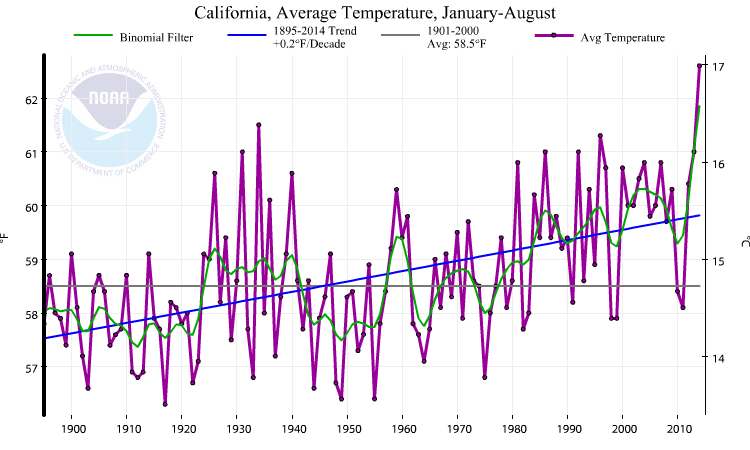
The emerging science of attributing extreme weather events to human-caused climate change is challenging, to say the least. The discussion above is an attempt to synthesize the various scientific reports that have thus far examined the link between the current California drought and climate change. While the fundamental science behind human-caused climate change is extremely well understood, pinpointing the particular meteorological impacts of global warming in specific regions is an endeavor subject to considerable uncertainty. One effect of global warming that is subject to very little uncertainty, however, is the reality of increasing temperatures. California’s record warmest year occurs at the peak of a sustained, long-term warming trend in the state over the past century or so—the same period over which the Earth’s global mean temperature has risen by 1.5° F. Since high temperatures can substantially amplify existing droughts by increasing evaporation and inducing self-reinforcing land/atmosphere feedback loops, it’s highly plausible that this represents an additional human fingerprint upon the observed trend of increasing extreme dryness in California—a topic that we continue to investigate in ongoing research.
References
Funk, C., A. Hoell, and D. Stone, 2014: Examining the Contribution of the Observed Global Warming Trend to the California Droughts of 2012/2013 and 2013/2014 [in “Explaining Extremes of 2013 from a Climate Perspective”], Bull. Amer. Meteor. Soc., 95 (9), S11–S15.
Sewall, J.O., and L.C. Sloan, 2004: Disappearing Arctic sea ice reduces available water in the American west, Geophys. Res. Lett., 31 (6), L06209.
*Swain, D. L., M. Tsiang, M. Haugen, D. Singh, A. Charland, B. Rajaratnam, and N. S. Diffenbaugh, 2014: The Extraordinary California Drought of 2013/2014: Character, Context, and the Role of Climate Change [in “Explaining Extremes of 2013 from a Climate Perspective”], Bull. Amer. Meteor. Soc., 95 (9), S3–S7.
Wang, S.-Y., L. Hipps, R. R. Gillies, and J. Yoon, 2014: Probable causes of the abnormal ridge accompanying the 2013–2014 California drought: ENSO precursor and anthropogenic warming footprint, Geophys. Res. Lett., 41 (9), 3220-3226.
Wang, H., and S. Schubert, 2014: Causes of the Extreme Dry Conditions over California During Early 2013 [in “Explaining Extremes of 2013 from a Climate Perspective”], Bull. Amer. Meteor. Soc., 95 (9), S7–S11.
The full BAMS report, “Explaining the Extremes of 2013 from a Climate Perspective,” can be accessed here.
Discover more from Weather West
Subscribe to get the latest posts sent to your email.